Educational
How to Do Reporting Season: A Practical Guide for Labelled Bond Funds
A comprehensive manual for asset managers creating impact and allocation reports for portfolios containing green, social, and other labelled sustainability bonds
Sep 29, 2025 @ London
This guide provides a practical framework for developing robust labelled bond portfolio reports that satisfy stakeholder expectations while telling a compelling story about your fund's environmental and social impact.
Asset managers increasingly hold labelled bonds as part of their sustainable investment strategies, but many face challenges when it comes to comprehensive portfolio reporting. To aggregate data across multiple bonds from different issuers to create meaningful portfolio-level insights is no small feat - issuers' annual post-issuance reporting approaches vary widely, with different impact metrics reported and different ways of reporting allocations. To process the large volume of data manually to create any meaningful narrative is confusing and tedious. Fortunately, with ClimateAligned's unprecedented coverage of the GSS bond market, this reporting process is made much easier and cheaper than ever before.
This guide provides a practical framework for developing robust labelled bond portfolio reports that satisfy stakeholder expectations while telling a compelling story about your fund's environmental and social impact.
Pre-Work: Defining Your Reporting Strategy
Establishing Your Narrative
Before diving into data collection, successful portfolio reporting requires clarity on your investment narrative and objectives. Different asset managers focus on distinct aspects of impact, and your reporting should reflect your fund's specific priorities.
While almost all funds report on how their bonds were allocated, some will highlight geographic diversity, others will focus on granular project types, others will focus on SDG impact, and others will do some combination of all of them. For some asset managers, simple use of proceeds categories is enough. For others, details on amount allocated to offshore wind vs. onshore wind is critical to their narrative.
Some environmentally funds will focus their impact metrics solely on emissions avoided, while others will include a range of environmental metrics related to impact from waste processed to renewable energy added. Other funds are more focused on social impact or on holistic sustainability, focusing on beneficiaries reached and social outcomes, and SDG alignment.
Depending on your funds focused, understanding which types of allocations and what types of data you want to focus on first will save you the headache of drowning in the variety of data and analysis possible. Issuers report on all kinds of metrics and allocations - its up to you to choose what is your priority.
Consider these fundamental questions to shape your reporting approach:
- What sustainability outcomes matter most to your investors?
- How does your labelled bond strategy connect to your broader ESG objectives?
- What story do you want to tell about year-over-year progress?
- Which metrics will most effectively demonstrate your fund's unique value proposition?
The answers to these questions will guide your selection of impact metrics, allocation categories, and determine the structure of your final report.
Understanding Impact Metrics
Primary Impact Metrics in Labelled Bonds
Emissions Avoided: The Foundation Metric
Emissions avoided is the most commonly reported impact metric across labelled bonds, representing the greenhouse gas emissions that would have been released under a business-as-usual scenario but were prevented due to the green investment. This metric is crucial because it:
- Provides a standardised measure of climate impact across different project types and enables meaningful comparison between investments
- Connects financial flows to tangible environmental outcomes
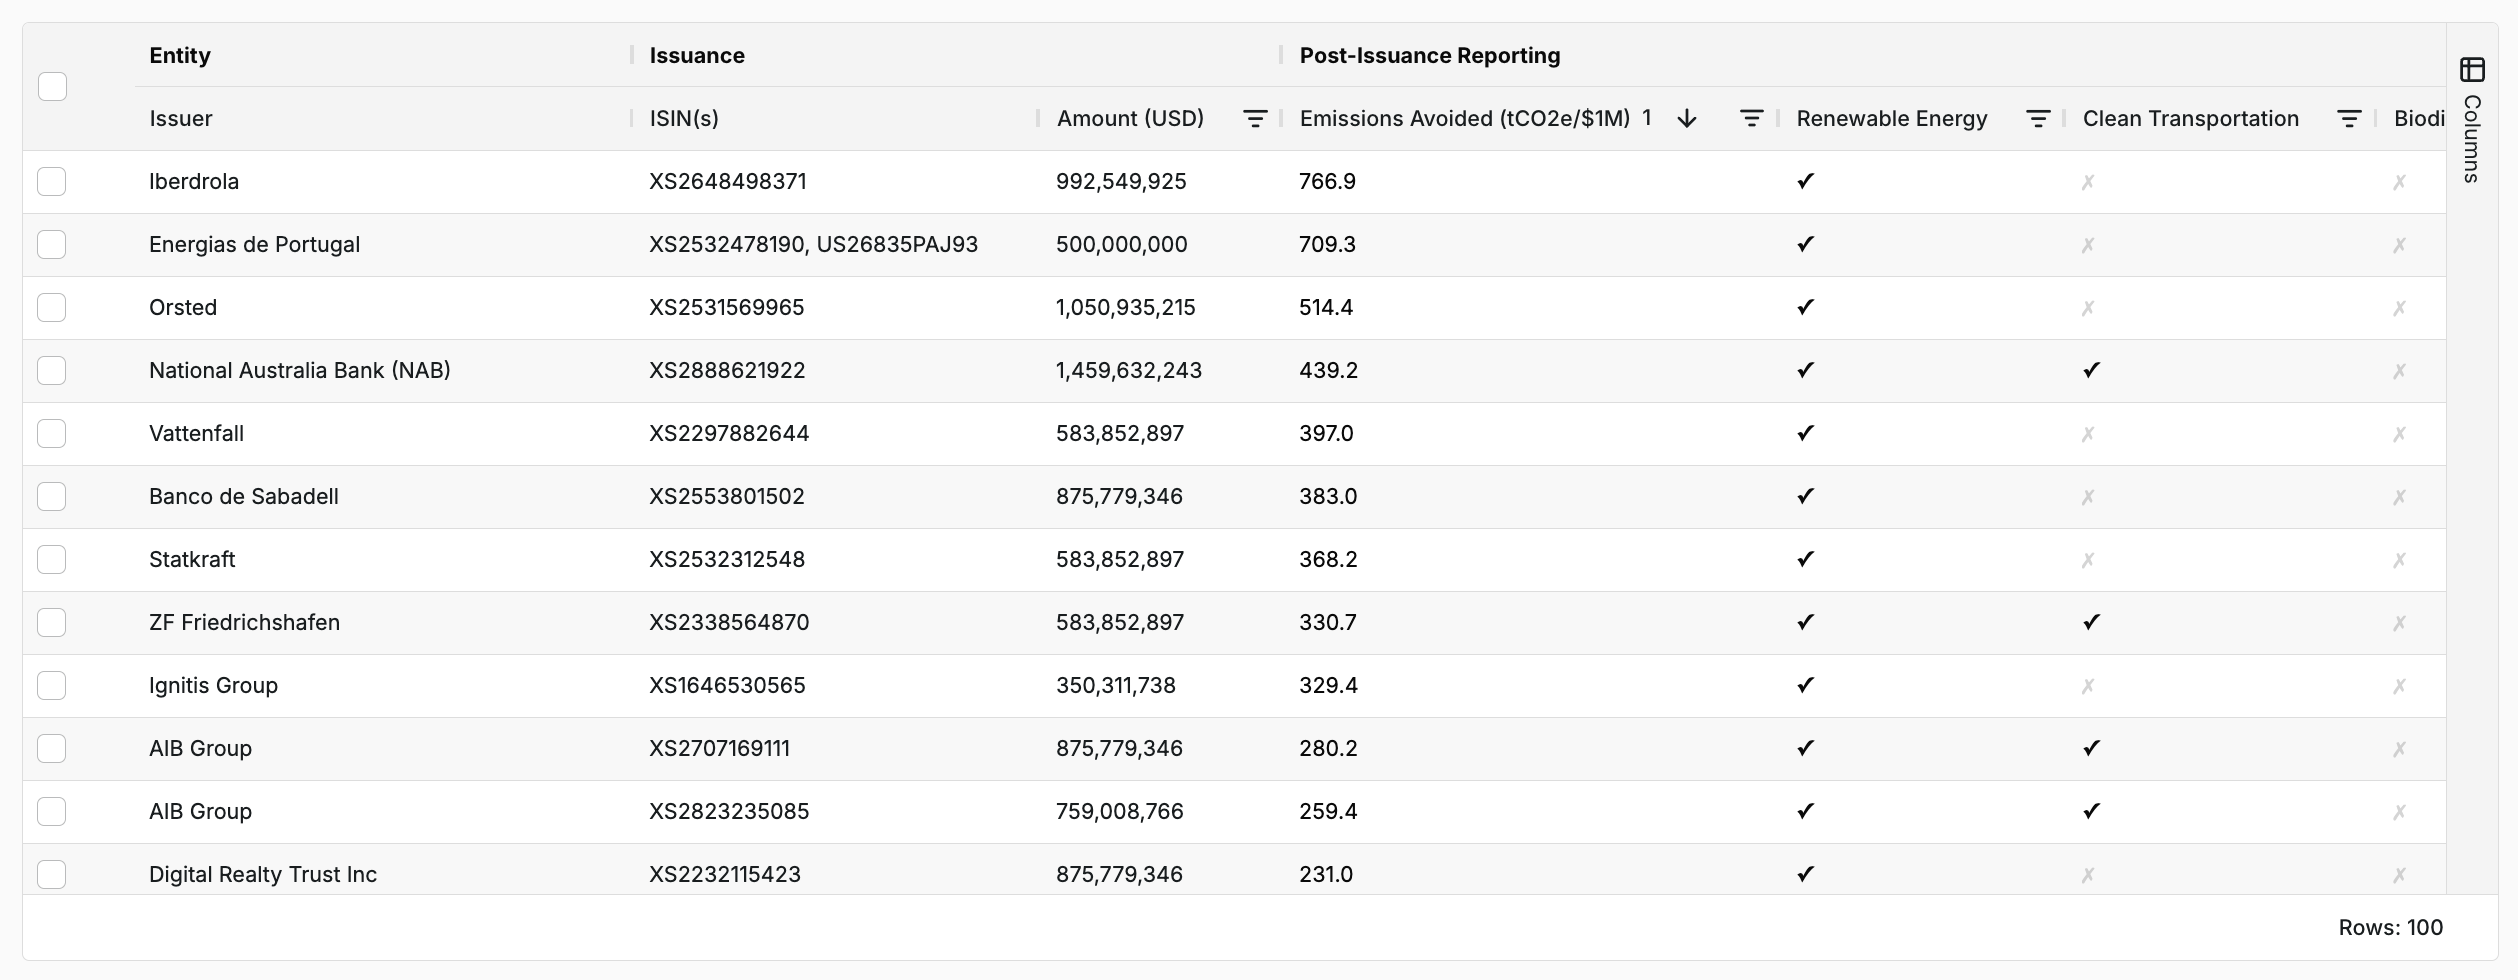 ClimateAligned's platform standardises calculations on emissions avoided to allow for easy comparison across the market.
Energy-Related Metrics
Energy metrics frequently appear in labelled bond reporting:
- Renewable energy capacity installed (MW)
- Energy savings achieved (MWh)
- Clean energy generation (MWh annually)
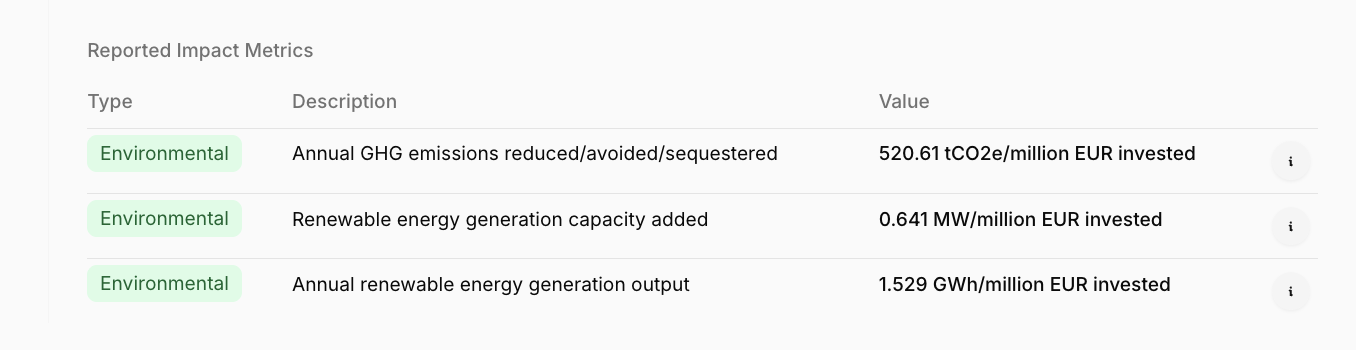 Impact metrics in ClimateAligned's platform for Iberdrola's July 2023 bond, which was exclusively allocated towards renewable energy.
Water and Resource Metrics
Another common environmental metric category to report on is water and resource-related metrics.
- Water saved or treated (cubic meters)
- Waste diverted from landfills (tonnes)
- Resource efficiency improvements
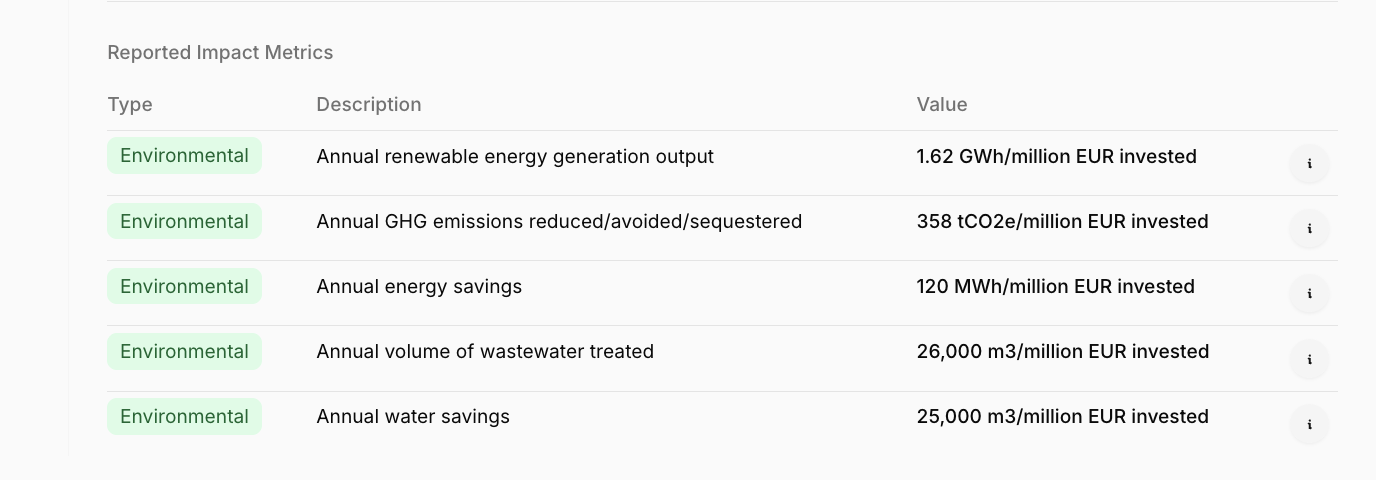 Caixabank's February 2021 green bond includes a wide range of investments, including some with positive water impacts, via sustainable water and wastewater management and green buildings.
Social Impact Metrics
- Number of beneficiaries reached
- Jobs created or supported
- Housing units provided
- People with improved access to services
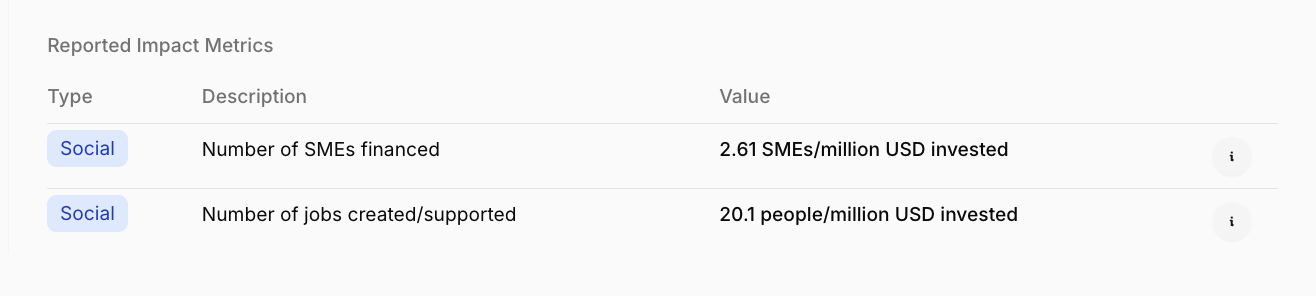 Hong Kong Mortgage Corporation's September 2023 social bond invests in SMEs, supporting local businesses and job creation.
The metrics listed above are some of the most common, but is by no means comprehensive. Other metrics related to clean transportation (such as passengers, track length) or energy storage capabilities added, are all reported on. All of these metrics are included in ClimateAligned's database, calculated to a per million invested level, to make it easy to proportion your fund's particular impact to each of these metrics.
Understanding Metric Limitations and Variations
The reality of labelled bond impact reporting is that different issuers use varying methodologies, time frames, and baseline assumptions. Some report annual impact, others report cumulative impact over project lifespans. Some provide highly detailed calculations, others offer only high-level estimates.
This variation means portfolio-level aggregation requires careful consideration of:
- Time frame - is this an annual vs. lifetime metric?
- Is this metric for this particular bond's investment into a project, or is it for the entire project?
- etc.
In ClimateAligned' platform, we clearly sign post when reporting isn't clear for impact reporting. While our AI does its best to calculate impact, inconsistency in reporting methodology in the market means that metrics reported by issuers can be misleading and require human oversight.
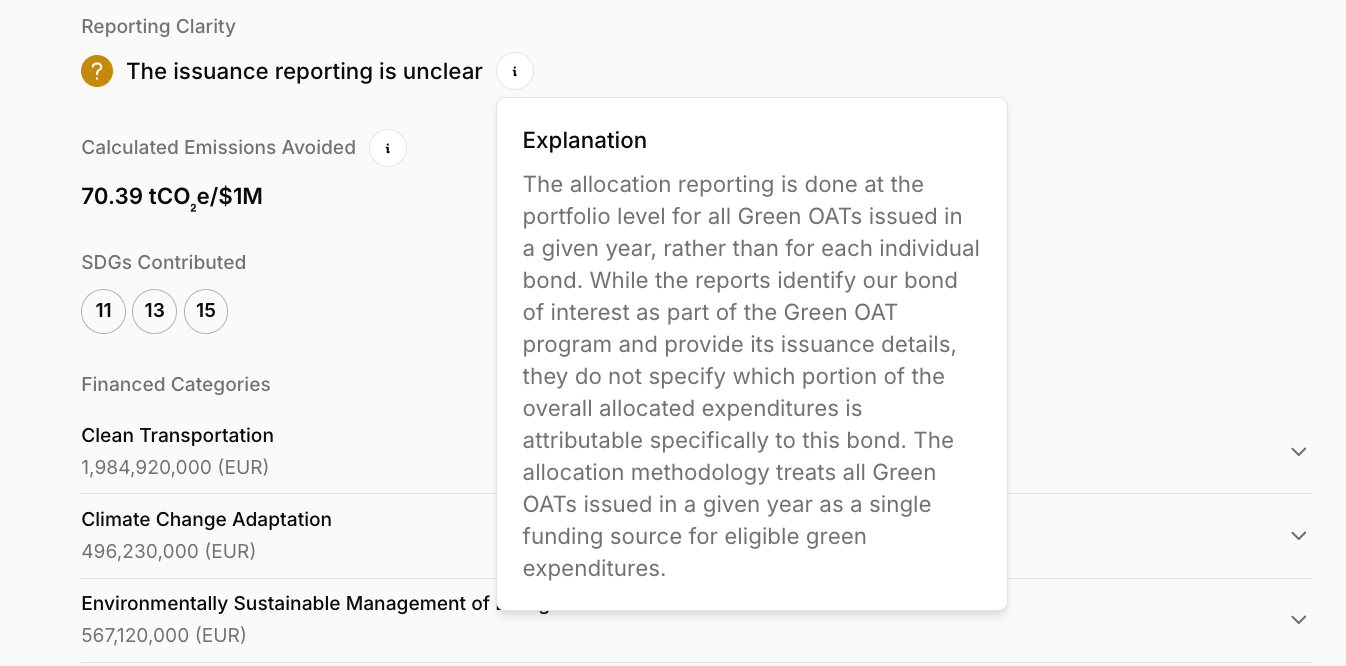 As noted in the image, France reports Green OAT performance in aggregate by issuance year, so reporting on individual bond allocations requires additional, reasonable assumptions.
Aggregating Allocations
By ICMA Use of Proceeds Categories
The most straightforward aggregation approach uses the standardised ICMA Use of Proceeds categories:
Green Bond Categories:
- Renewable Energy
- Energy Efficiency
- Clean Transportation
- Sustainable Water Management
- Climate Change Adaptation
- Pollution Prevention and Control
- Circular Economy
- Green Buildings
- Sustainable Land Use
Social Bond Categories:
- Affordable Basic Infrastructure
- Access to Essential Services
- Affordable Housing
- Employment Generation
- Food Security
- Socioeconomic Advancement and Empowerment
This approach provides a clear, industry-standard view of how your portfolio capital is distributed across different sustainability themes.
By Technology and Project Subcategories
For more granular analysis, ClimateAligned App's technology subcategorisation enables deeper insights:
| ICMA Category | CA Subcategories |
|---|---|
| Renewable Energy | • Renewables (unspecified) • Onshore Wind • Offshore Wind • Hydropower • Solar • Nuclear • Geothermal • Biomass • Hydrogen • Marine Renewables + Other Renewables |
| Energy Efficiency | • Battery Storage + Grid Improvements • ICT & Telecoms & Other Efficiency Upgrades • General Energy Efficiency |
| Pollution Prevention and Control | • Waste Management (general) |
| Environmentally Sustainable Management of Living Natural Resources & Land Use | • Sustainable Land Use • (General) Sustainable Forestry |
| Clean Transportation | • Rail (Trains and Infrastructure) • Electric Vehicles (Passenger vehicles and infrastructure) • Hybrid Vehicles • Electric Buses • Shipping, Maritime Transport |
| Green Buildings | • Green Buildings (general) • Residential Buildings • Commercial Buildings |
This granular approach helps identify specific exposures and can inform strategic decisions about future investments.
By Project-Level Analysis
Using detailed project information available through ClimateAligned App, you can create compelling case studies that illustrate your portfolio's real-world impact:
Project Case Study Elements:
- Specific project description and location
- Technology deployed and capacity
- Expected beneficiaries or environmental impact
- Connection to broader sustainability goals
- Your fund's contribution to the project's success
These project-level insights transform abstract allocation percentages into tangible stories about infrastructure development, community benefits, and environmental progress.
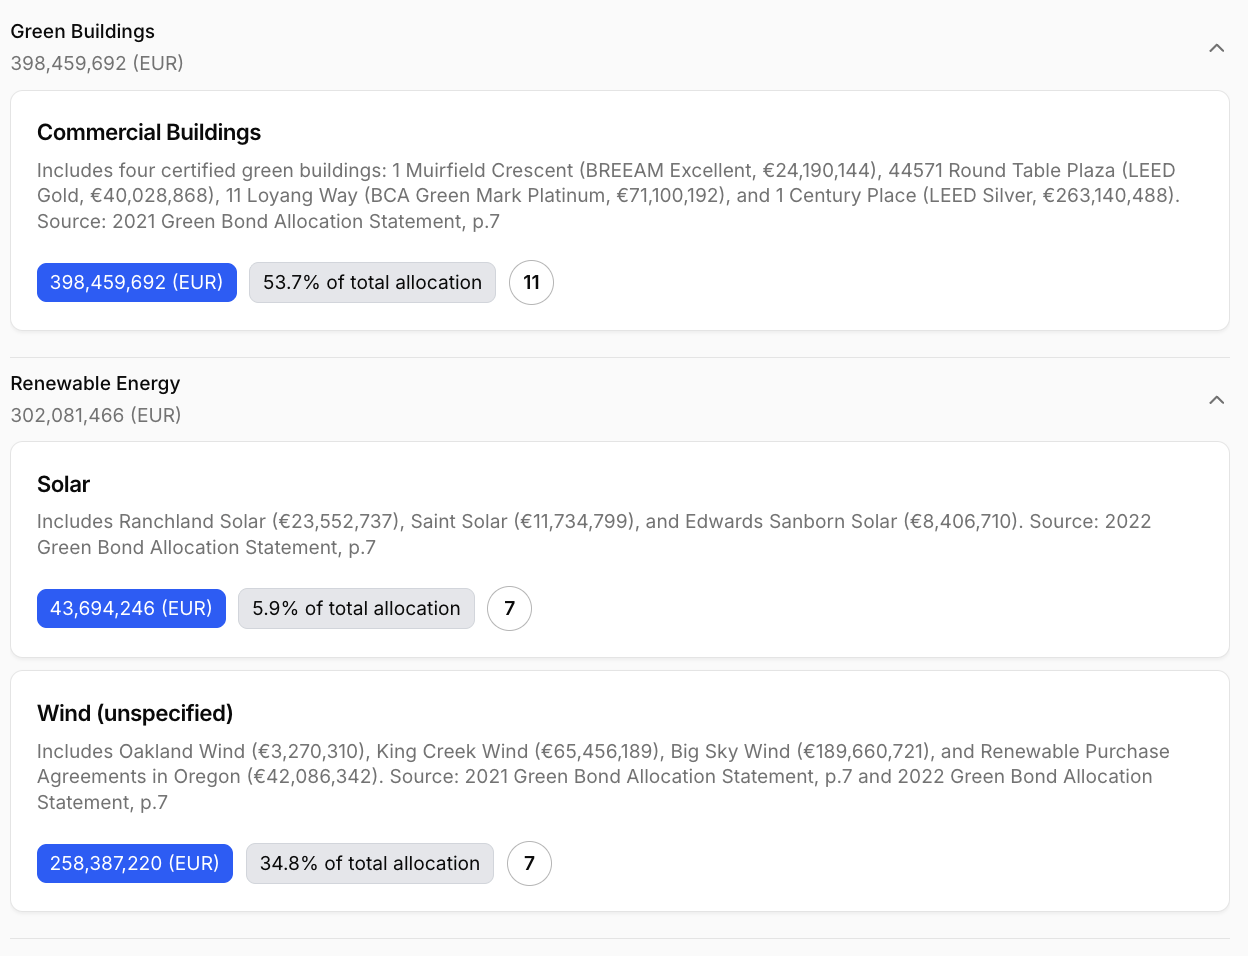 In this example from Digital Realty Trust, you can see how the ClimateAligned platform picks up detailed project information in the allocation descriptions to streamline finding compelling case studies.
By SDG Alignment
Many institutional investors increasingly request SDG-aligned reporting. ClimateAligned App's SDG mapping enables portfolio-level analysis showing contribution to:
Most Relevant SDGs for Labelled Bonds:
- SDG 7: Affordable and Clean Energy
- SDG 11: Sustainable Cities and Communities
- SDG 13: Climate Action
- SDG 6: Clean Water and Sanitation
- SDG 9: Industry, Innovation and Infrastructure
This approach demonstrates how your labelled bond investments contribute to global sustainable development objectives.
Creating Comprehensive Reports
Report Structure and Components
Executive Summary
- Portfolio overview and key metrics
- Year-over-year changes and trends
- Primary achievements and impact highlights
- Connection to fund's sustainability objectives
Portfolio Composition
- Allocation breakdown by ICMA categories
- Geographic distribution of investments
- Issuer diversification and credit quality
- Technology and sector exposure analysis
Impact Analysis
- Aggregated impact metrics with clear methodological notes
- Comparison to previous reporting periods
- Standout project case studies
- Contribution to broader sustainability goals
Looking Forward
- Pipeline of potential future investments
- Evolving impact measurement approaches
- Strategic priorities for upcoming periods
Addressing Reporting Challenges
Time Scale Variations Different issuers report impact over different time horizons—some annually, others cumulatively over project lifespans. Your portfolio report should:
- Clearly specify the time frame for each metric
- Avoid inappropriate aggregation of annual and cumulative figures
- Provide context about when full project impact will be realised
Portfolio vs. Individual Bond Reporting Many issuers report at their overall portfolio level rather than for specific bonds, making attribution challenging. Address this by:
- Using pro-rata attribution based on your investment size
- Clearly disclosing when data represents estimated allocation
- Focusing on trends and direction rather than precise figures when data quality varies
Data Quality Transparency Be transparent about data limitations:
- Indicate which metrics are reported by issuers vs. estimated
- Explain any assumptions used in aggregation
- Acknowledge where comparability may be limited due to methodological differences
Leveraging ClimateAligned App for Enhanced Reporting
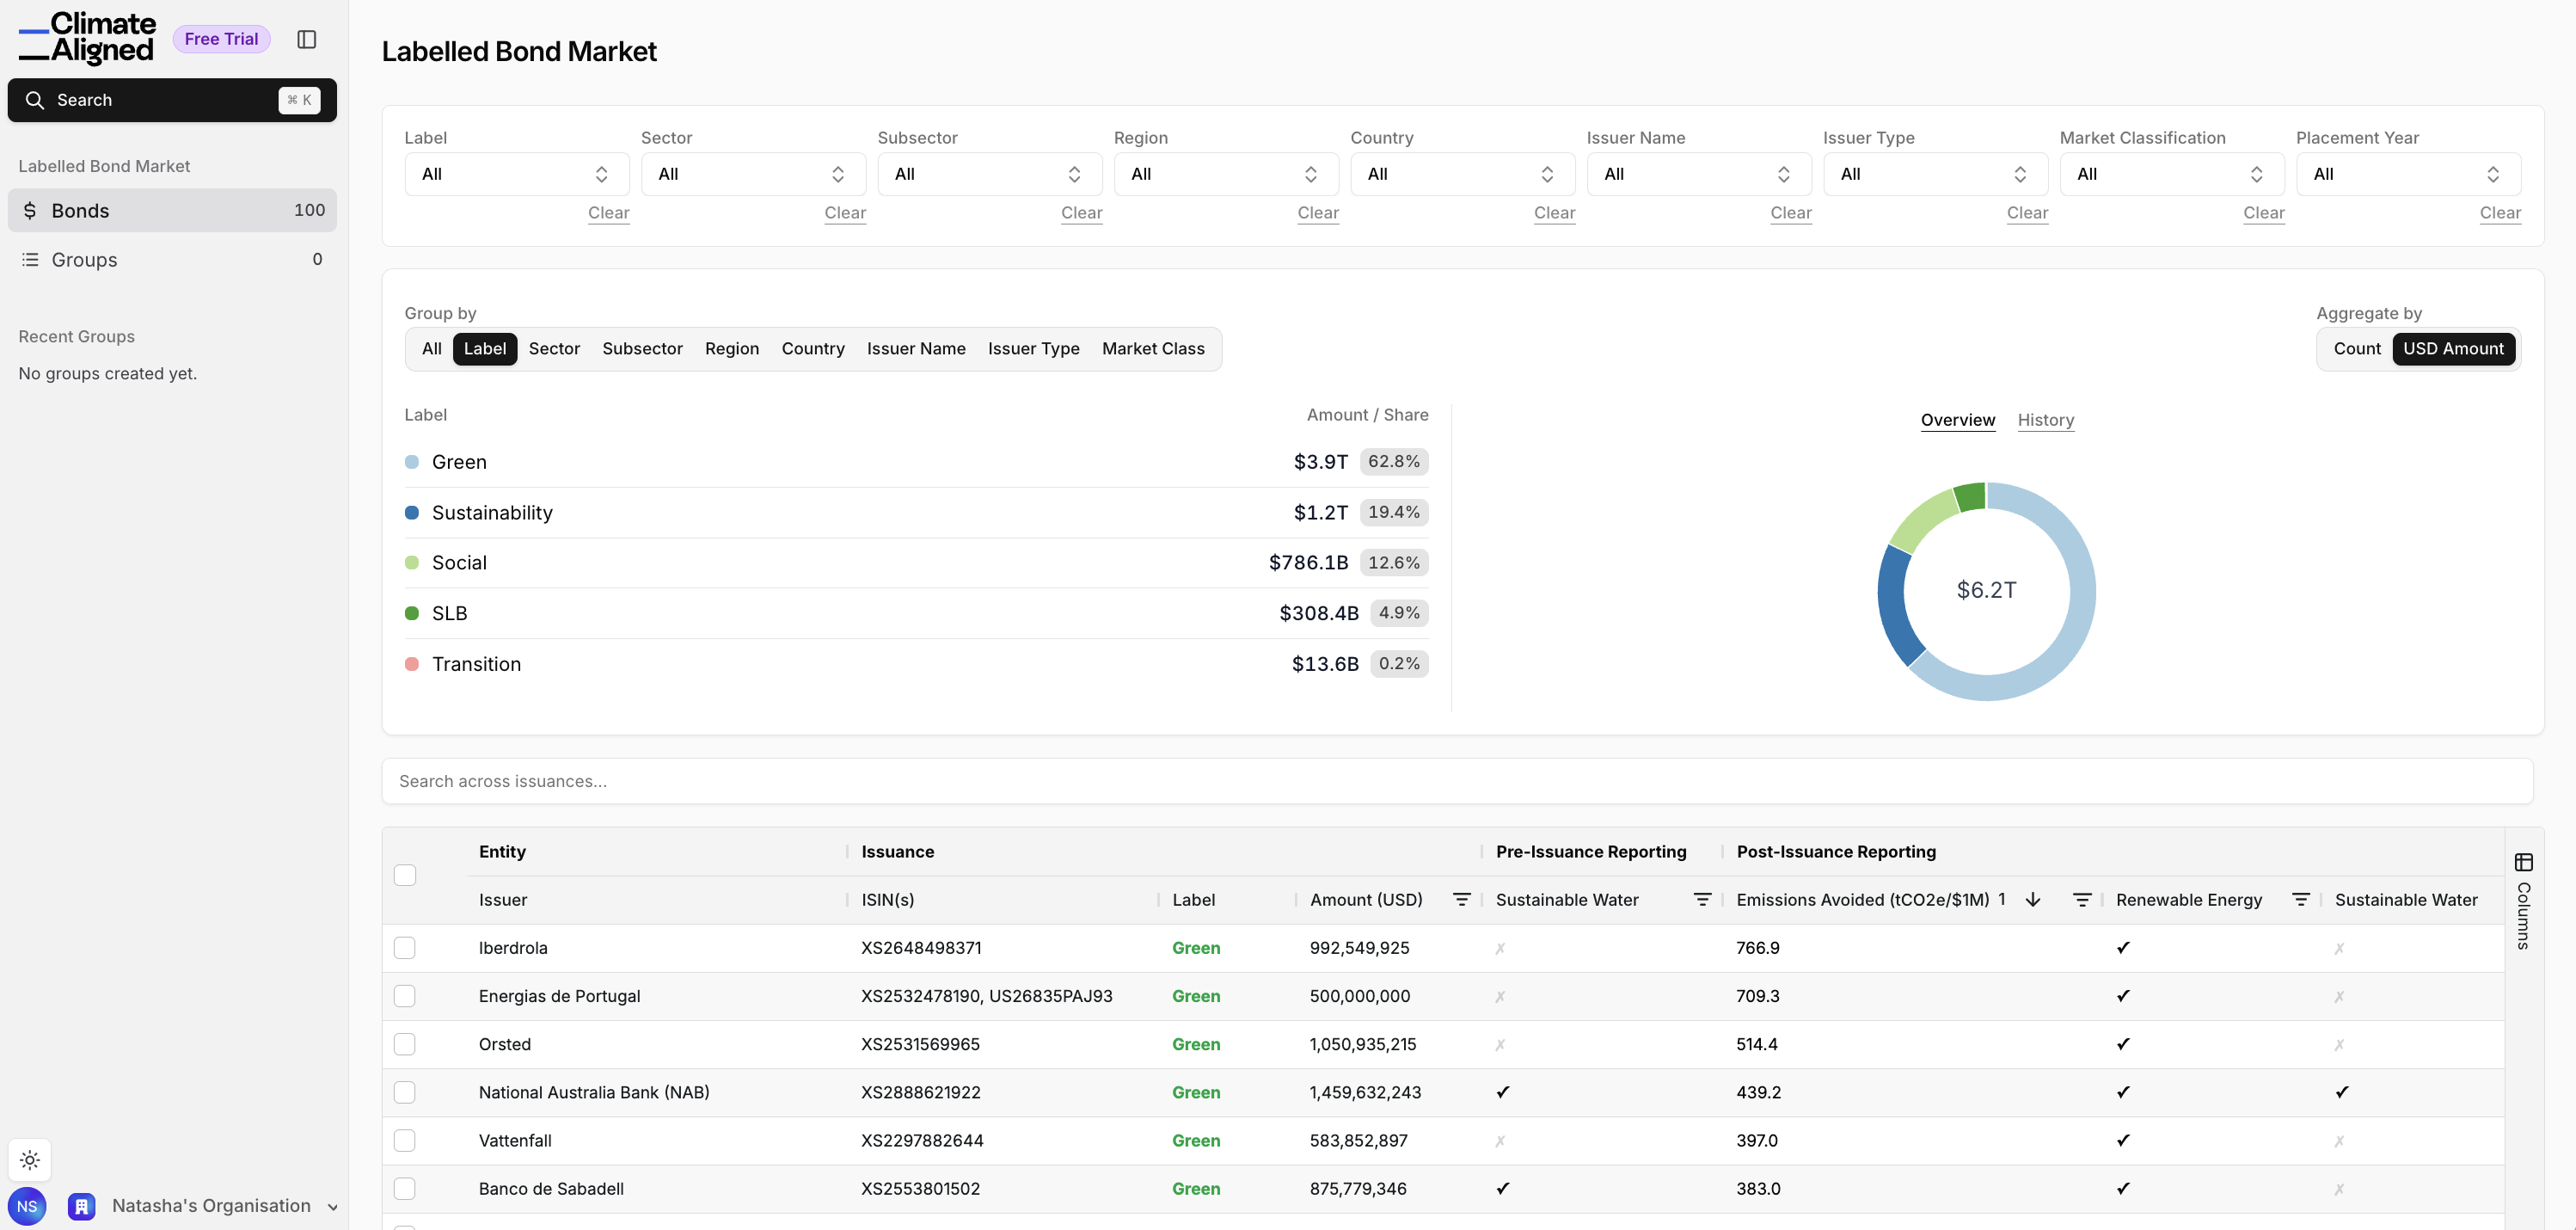 ClimateAligned app
ClimateAligned App addresses many traditional challenges in labelled bond reporting by providing:
Standardised Impact Metrics
- Emissions avoided calculations using consistent methodologies
- Per-million-invested metrics enabling direct portfolio comparison
- Comparable GHG emissions calculations across all holdings
Granular Allocation Data
- Technology-level breakdowns for every ICMA category
- Project-level details for case study development
- Geographic analysis down to specific regions and countries
Scalable Analysis
- Adjust impact calculations to your exact investment amounts
- Compare impact efficiency across different bonds and issuers
- Track portfolio-level changes over time with consistent baselines
Enhanced Narrative Development With ClimateAligned App's comprehensive data, you can:
- Identify your portfolio's strongest impact areas
- Develop compelling case studies using project-level details
- Create sophisticated year-over-year trend analysis
- Support strategic decisions with comparative impact data
Practical Implementation
For asset managers new to comprehensive impact reporting, ClimateAligned App offers:
- Automated data aggregation eliminating manual compilation
- Flexible export capabilities for integration with existing reporting tools
- Cost-effective access to institutional-grade sustainability data
- Regular updates ensuring current information for all holdings
Conclusion
Effective labelled bond portfolio reporting requires combining clear strategic thinking about your sustainability narrative with robust data analysis and transparent communication about both achievements and limitations.
The complexity of aggregating impact data across diverse issuers and reporting standards means that access to comprehensive, standardised data sources like ClimateAligned App has become essential for asset managers seeking to provide meaningful transparency to their stakeholders.
By following the framework outlined in this guide—from establishing your narrative through leveraging advanced data sources—asset managers can create compelling reports that demonstrate the real-world impact of their sustainable investment strategies while building confidence with institutional investors and other stakeholders.
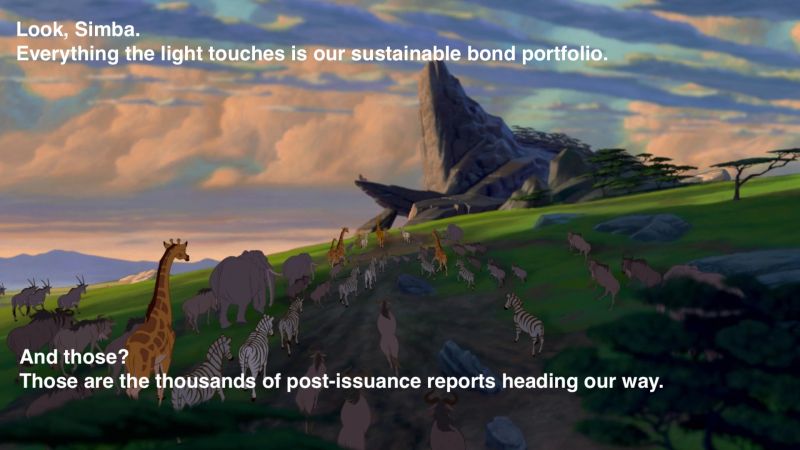 By the end of the process, you'll be feeling like the king of Pride Rock
ClimateAligned App provides the comprehensive labelled bond data and impact analytics needed for sophisticated portfolio reporting, available for £1,000 monthly or £10,000 annually for a team with flexible export capabilities and technology-level allocation details unavailable elsewhere in the market.